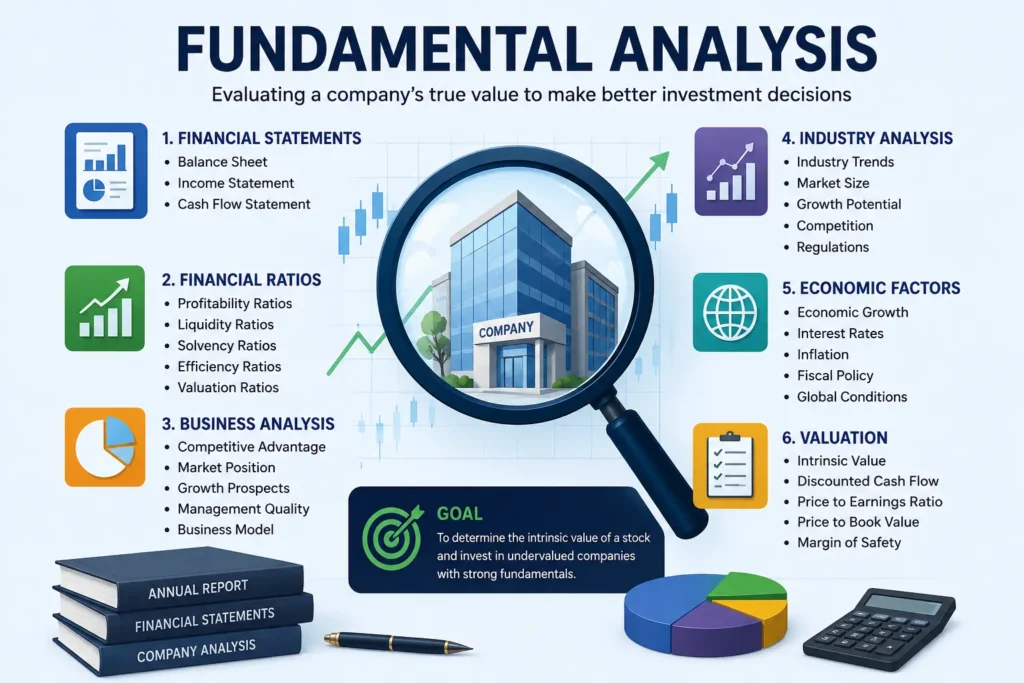

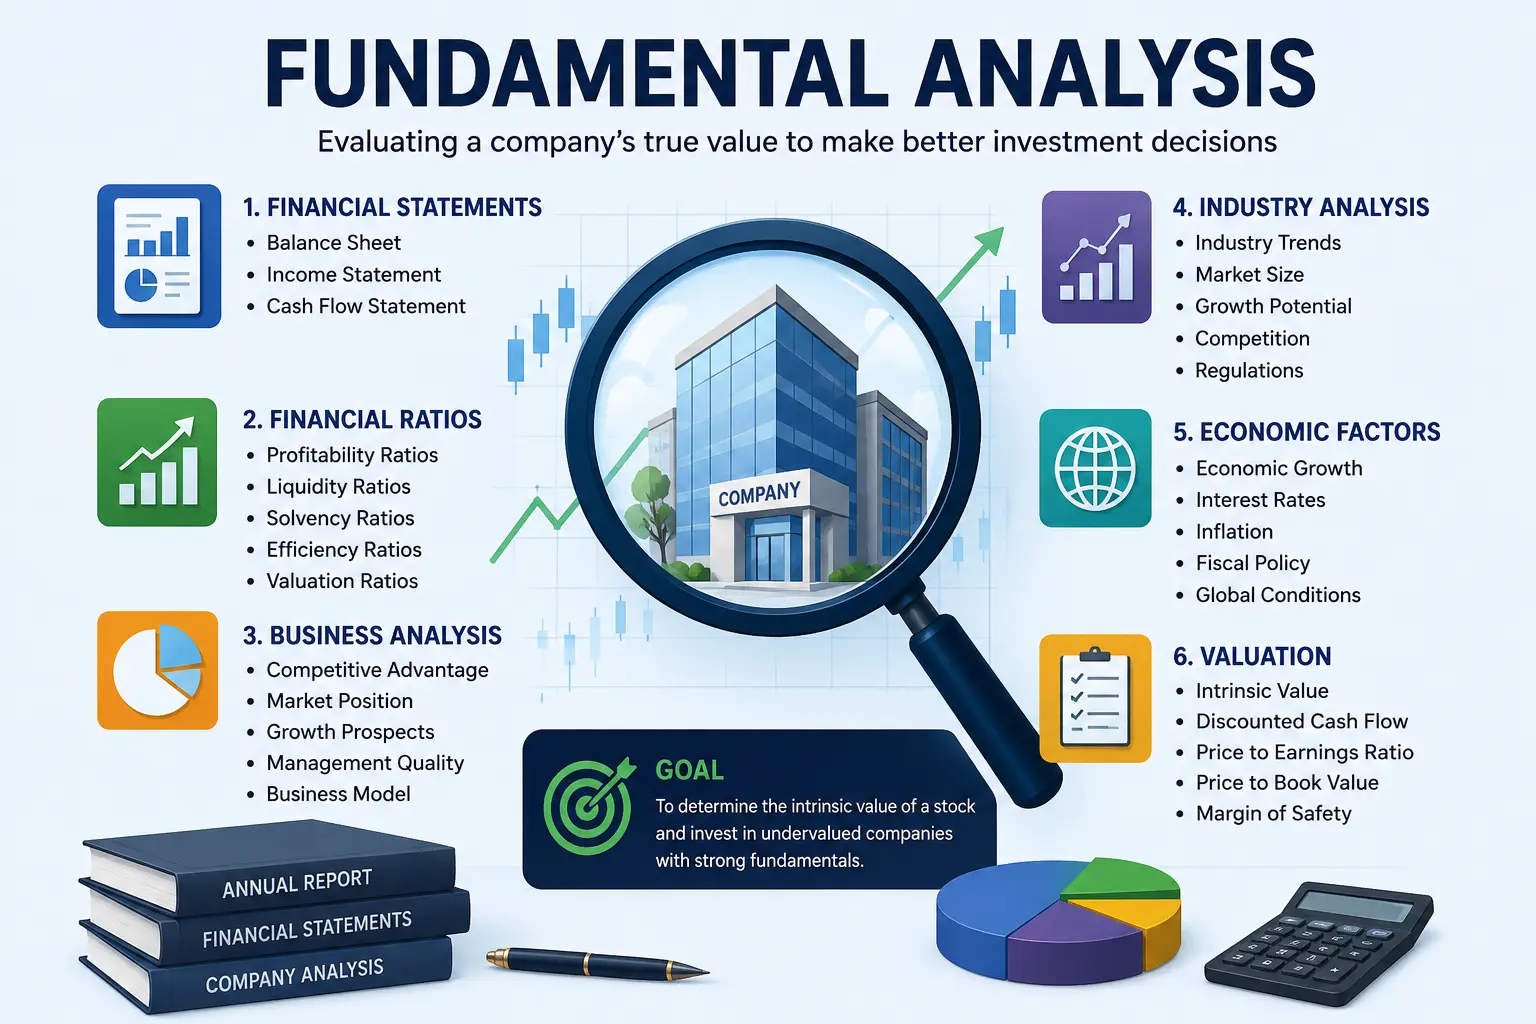
Fundamental analysis is the practice of evaluating a company’s financial health, earnings power, and business quality to estimate what it’s actually worth — separate from whatever its stock price happens to be doing today. Stock prices move for all kinds of short-term reasons: market sentiment, news headlines, momentum, even rumors. But over the long run, prices tend to follow something more concrete: the underlying performance of the business itself.
That’s the core distinction this guide is built around — the difference between price (what you pay) and value (what you get). A stock can be expensive at a low price if the business is deteriorating, and cheap at a high price if the business is compounding profits year after year. Fundamental analysis is how investors — from complete beginners to Warren Buffett — work out which is which.
By the end of this guide, you’ll understand the three core financial statements, the ratios that matter most, how to read an annual report, how to spot a quality company, the basics of valuation and intrinsic value, and a simple repeatable framework you can use to evaluate any stock in about ten minutes.
What Is Fundamental Analysis?
Fundamental analysis is the process of examining a company’s financial statements, business model, management quality, industry position, and competitive advantages to determine its intrinsic value — what the business is genuinely worth, independent of its current market price.
Here’s a simple example. Imagine two companies:
- Company A grows revenue steadily every year, turns a healthy profit, and generates real cash from its operations.
- Company B has exciting news headlines and a rising share price, but it has never turned a profit and burns through cash every quarter.
Which is more attractive to a long-term investor? Fundamental analysis says Company A — because a business that earns money and grows sustainably is more likely to keep creating value for shareholders than one running on hype alone. Price can diverge from value in the short term, but fundamentals are what tend to win out over years.
Key takeaway: Fundamental analysis answers “is this a good business, and is it fairly priced?” — not “will the price go up next week?”
Fundamental Analysis vs Technical Analysis
| Factor | Fundamental Analysis | Technical Analysis |
|---|---|---|
| Objective | Determine a company’s intrinsic value | Time entries and exits based on price behavior |
| Data Used | Financial statements, ratios, industry data, management quality | Price charts, volume, indicators, patterns |
| Time Horizon | Months to years | Minutes to months |
| Best For | Long-term investors, wealth builders | Traders, short-term market timing |
| Advantages | Grounded in real business performance; supports long-term conviction | Fast decision-making; works across any liquid market |
| Limitations | Slow to react to short-term price swings; requires research effort | Doesn’t explain the “why” behind price moves; can generate false signals |
In practice, many investors combine both: fundamentals to decide what to buy, and technicals to help decide when to buy it. If you’re building a long-term portfolio, fundamentals should do most of the heavy lifting.
The Three Financial Statements
Every public company publishes three core financial statements. Learning to read them is the foundation of fundamental analysis.
Income Statement
The income statement (also called the profit and loss statement) shows how much money a company made and spent over a period, typically a quarter or a year.
- Revenue: Total money earned from selling goods or services, before any costs are subtracted.
- Gross Profit: Revenue minus the direct cost of producing goods or services (cost of goods sold).
- Operating Profit: Gross profit minus operating expenses like salaries, rent, and marketing.
- EBITDA: Earnings before interest, tax, depreciation, and amortization — a rough measure of core operating performance.
- Net Profit: What’s left after all expenses, interest, and taxes — the “bottom line.”
- EPS (Earnings Per Share): Net profit divided by the number of outstanding shares — how much profit is attributable to each share you own.
Worked example: If a company earns $100 million in revenue, spends $60 million producing its goods (gross profit = $40 million), spends $15 million on operating costs (operating profit = $25 million), and pays $5 million in interest and taxes, net profit is $20 million. With 10 million shares outstanding, EPS = $2.00.
Balance Sheet
The balance sheet is a snapshot of what a company owns and owes at a single point in time.
- Assets: Everything the company owns — cash, inventory, property, equipment, and investments.
- Liabilities: Everything the company owes — loans, supplier payments, and other obligations.
- Shareholders’ Equity: Assets minus liabilities — what would theoretically be left for shareholders if the company paid off everything it owed.
- Current Assets: Assets expected to convert to cash within a year, like inventory and receivables.
- Current Liabilities: Obligations due within a year.
- Cash: The most liquid asset a company holds; a healthy cash position provides a buffer during downturns.
- Debt: Borrowed money the company must repay, with interest, over time.
Cash Flow Statement
The cash flow statement tracks the actual movement of cash in and out of the business — arguably the hardest statement to manipulate, and one of the most telling.
- Operating Cash Flow: Cash generated from core business operations.
- Investing Cash Flow: Cash spent on or received from investments, like buying equipment or acquiring other businesses.
- Financing Cash Flow: Cash flow from borrowing, repaying debt, issuing shares, or paying dividends.
- Free Cash Flow: Operating cash flow minus capital expenditures — the cash a company actually has left over after maintaining and growing its asset base.
Practical interpretation: A company can report a healthy net profit on its income statement while actually bleeding cash — for example, if it’s booking sales it hasn’t yet collected payment for. That’s why experienced investors always cross-check reported profit against operating and free cash flow before trusting the earnings number.
Red flag: Consistently rising net profit alongside consistently negative or shrinking free cash flow is one of the clearest warning signs in fundamental analysis.
The Most Important Fundamental Ratios
Ratios turn raw financial statement numbers into comparable, meaningful signals. Here are the ones that matter most.
| Ratio | Formula | What It Measures | Good Range | Warning Sign |
|---|---|---|---|---|
| PE Ratio | Share Price ÷ EPS | How much investors pay per dollar of earnings | Varies by industry; often 10–25 for mature companies | Very high PE with no earnings growth to justify it |
| PB Ratio | Share Price ÷ Book Value per Share | Price relative to net asset value | Below industry average, especially under 3 for most sectors | High PB with weak ROE |
| PEG Ratio | PE Ratio ÷ EPS Growth Rate | Valuation adjusted for growth | Around 1 or below is often considered reasonable | PEG well above 2 without exceptional quality |
| ROE | Net Profit ÷ Shareholders’ Equity | Profitability relative to shareholder capital | 15% or higher is generally strong | Declining or below industry average |
| ROCE | Operating Profit ÷ Capital Employed | Efficiency of using all capital, including debt | 15%+ is generally considered healthy | Consistently below cost of capital |
| Debt-to-Equity | Total Debt ÷ Shareholders’ Equity | Financial leverage and risk | Under 1 is generally conservative for most sectors | Above 2, especially with weak cash flow |
| Current Ratio | Current Assets ÷ Current Liabilities | Short-term liquidity | 1.5–3 is generally comfortable | Below 1 signals possible liquidity stress |
| Quick Ratio | (Current Assets − Inventory) ÷ Current Liabilities | Liquidity excluding inventory | Above 1 is generally solid | Well below 1 |
| Operating Margin | Operating Profit ÷ Revenue | Core business efficiency | Higher than industry peers | Shrinking margin over time |
| Net Profit Margin | Net Profit ÷ Revenue | Overall profitability | Varies widely by sector | Thin or negative margins |
| Dividend Yield | Annual Dividend per Share ÷ Share Price | Income return relative to price | Depends on strategy; sustainable payout matters more than a high number | Unusually high yield often signals a falling share price or unsustainable payout |
| Interest Coverage Ratio | EBIT ÷ Interest Expense | Ability to service debt from earnings | Above 3 is generally considered safe | Below 1.5 signals debt-servicing risk |
Key takeaway: No single ratio tells the whole story. A low PE could mean a bargain — or a business in decline. Ratios only become meaningful when read together and compared against industry peers and historical trends.
How to Read an Annual Report
An annual report is the single richest source of information about a company. Here’s how to work through one efficiently:
- Chairman’s Letter: Sets the tone — look for candor about challenges, not just achievements.
- Business Overview: Understand what the company actually does, its segments, and its markets.
- Risk Factors: Management’s own disclosure of what could go wrong — often underread but highly informative.
- Management Discussion & Analysis (MD&A): Management’s explanation of the year’s performance, in their own words.
- Financial Statements: The income statement, balance sheet, and cash flow statement in full detail.
- Notes to Accounts: The fine print — accounting policies, contingent liabilities, related-party details, and other disclosures that don’t fit neatly into the main statements.
- Auditor’s Report: Look specifically for any qualifications, emphasis-of-matter notes, or going-concern warnings.
- Related Party Transactions: Deals between the company and its promoters, directors, or affiliated entities — worth scrutinizing for fairness.
Red flag: Frequent changes in auditors, qualified audit opinions, unusually complex related-party transactions, or a management tone that shifts from confident to vague year over year.
How to Identify a Quality Company
Use this checklist when screening a potential investment:
- ☐ Consistent revenue growth over the past 5+ years
- ☐ Consistent profit growth, not just occasional spikes
- ☐ Positive and growing operating cash flow
- ☐ High ROE and ROCE relative to industry peers
- ☐ Low or manageable debt levels
- ☐ A strong, recognizable brand or market position
- ☐ A durable competitive advantage (moat)
- ☐ Management with a track record of honesty and capital discipline
- ☐ Valuation that’s reasonable relative to growth and quality
A company that checks most of these boxes is far more likely to compound shareholder value over time than one relying purely on market momentum.
Understanding Competitive Advantage (Economic Moat)
An economic moat is a structural advantage that protects a company’s profits from competitors over the long run. Common moat types include:
- Brand Moat: Customers pay a premium or stay loyal purely because of trust in the brand name.
- Network Effect: The product or platform becomes more valuable as more people use it, making it hard for new entrants to compete.
- Cost Advantage: The company can produce goods or services more cheaply than competitors, often through scale.
- Switching Costs: It’s expensive, risky, or inconvenient for customers to switch to a competitor.
- Patents and Licensing: Legal protections that block competitors from replicating a product for a set period.
For educational context: a business with strong brand loyalty in consumer goods, a bank with a large low-cost deposit base, or a software platform with high switching costs are all classic examples of moat categories — without this being investment advice about any specific company.
Growth vs Value Investing
| Style | Characteristics | Best Suited For |
|---|---|---|
| Growth Stocks | High revenue/earnings growth, often higher valuations, reinvest profits rather than pay dividends | Younger investors with a longer time horizon and higher risk tolerance |
| Value Stocks | Trading below estimated intrinsic value, often mature businesses with steady (not explosive) growth | Conservative investors seeking a margin of safety |
| Dividend Stocks | Stable earnings, consistent dividend payouts, often lower volatility | Income-focused investors, including those nearing or in retirement |
These styles aren’t mutually exclusive — many quality companies exhibit growth, value, and dividend characteristics simultaneously as they mature.
Intrinsic Value Explained
Intrinsic value is your best estimate of what a business is actually worth, based on its ability to generate cash for its owners over time — as distinct from whatever price the market happens to be quoting today.
Here’s an analogy: imagine a house with a fair market value of $300,000. If it’s listed for $250,000 because the seller needs to move quickly, you’re buying below intrinsic value. If it’s listed for $400,000 during a bidding war, you’re overpaying relative to what it’s actually worth — even though people are willing to pay it.
This is where margin of safety comes in — a concept popularized by Benjamin Graham and long championed by Warren Buffett. It means buying at a meaningful discount to your estimated intrinsic value, so that if your estimate turns out to be too optimistic, you still have a cushion protecting your investment.
Key takeaway: Margin of safety doesn’t guarantee you won’t lose money — it reduces the odds and severity of losses caused by being wrong about the future.
Discounted Cash Flow (DCF) Made Simple
A discounted cash flow model estimates intrinsic value by forecasting a company’s future cash flows and converting them into today’s money.
- Future Cash Flows: An estimate of the free cash flow the business will generate in future years.
- Discount Rate: The rate used to account for risk and the time value of money — a dollar today is worth more than a dollar in ten years.
- Present Value: Each future cash flow, reduced (“discounted”) back to what it’s worth in today’s terms.
- Terminal Value: An estimate of the business’s value beyond the forecast period, representing all cash flows far into the future.
Simple example: Suppose a company is expected to generate $10 million in free cash flow next year, growing steadily, and you apply a 10% discount rate. That $10 million is worth roughly $9.1 million in today’s terms ($10M ÷ 1.10). Repeat this for each future year, add a terminal value for cash flows beyond your forecast window, and sum everything up to arrive at an estimated intrinsic value for the business.
DCF models are sensitive to their assumptions — small changes in growth rate or discount rate can swing the output significantly, so treat the result as a rough estimate, not a precise number.
A 10-Minute Fundamental Analysis Framework
Use this repeatable checklist to quickly screen any stock:
- Revenue growth (5 years): Has revenue grown consistently, or is it flat/declining?
- Profit growth (5 years): Has net profit grown in line with or faster than revenue?
- ROE above industry average: Is the company generating strong returns on shareholder capital relative to peers?
- Debt manageable: Is debt-to-equity reasonable, and is interest coverage comfortable?
- Positive free cash flow: Is the business generating real cash, not just accounting profit?
- Promoter/insider ownership: Do insiders hold a meaningful stake, signaling aligned incentives?
- Valuation reasonable: Do PE, PB, and PEG look reasonable relative to growth and industry peers?
Key takeaway: This framework won’t replace deep research, but it’s an efficient first filter to separate genuinely interesting companies from ones not worth your time.
Example Stock Analysis (Educational Only)
The following is a fictional example created purely to illustrate the framework above. It does not represent any real company and is not investment advice.
ABC Industries (fictional company)
| Metric | Value |
|---|---|
| Revenue (latest year) | $500 million, up from $380 million five years ago |
| Net Profit | $45 million, up from $28 million five years ago |
| ROE | 18% |
| Debt-to-Equity | 0.6 |
| PE Ratio | 19 |
| Free Cash Flow | $38 million, positive for the past five consecutive years |
Educational interpretation: ABC Industries shows consistent revenue and profit growth, a healthy ROE, manageable debt, and positive free cash flow — traits associated with a fundamentally strong company in this illustrative example. A PE of 19 alongside double-digit earnings growth would generally be considered a reasonable, not excessive, valuation. Again, this is a simplified teaching example, not a real analysis of any actual stock.
Common Mistakes Beginners Make
- Buying a stock only because its price is rising
- Ignoring debt levels entirely
- Ignoring cash flow and focusing only on reported profit
- Trusting social media tips or “hot stock” forwards without verification
- Chasing cheap penny stocks purely because of low share price
- Overpaying for growth without checking valuation
- Never actually reading the annual report
- Confusing revenue growth with profit growth
- Ignoring industry context when judging ratios
- Treating a single quarter’s results as a long-term trend
- Failing to check promoter or insider selling activity
- Not comparing a company against its direct competitors
- Averaging down on a fundamentally deteriorating business
- Ignoring related-party transactions and governance red flags
- Expecting fundamental analysis to predict short-term price moves
Fundamental Analysis for NEPSE Investors
Investors in Nepal’s stock market (NEPSE) can apply the same fundamental principles, with a few local considerations:
- Where to find annual reports: Listed companies typically publish annual reports on their own investor-relations pages, and disclosures are also filed through NEPSE and the Securities Board of Nepal (SEBON).
- NEPSE company disclosures: Quarterly financial reports, AGM notices, and material event disclosures are published through the NEPSE website and company websites — checking these regularly helps you stay current.
- Sector-specific considerations:
- Banks and financial institutions: Focus on capital adequacy ratio, non-performing loans (NPL), and net interest margin rather than standard industrial ratios.
- Hydropower: Pay close attention to debt levels, project completion timelines, and seasonal cash flow variation tied to water availability.
- Insurance: Look at claims ratio, solvency margin, and premium growth alongside standard profitability metrics.
- Manufacturing: Working capital cycles, raw material cost exposure, and capacity utilization are especially important.
- Why cash flow matters even more in capital-intensive sectors: Businesses like hydropower and manufacturing require heavy upfront investment, so free cash flow — not just reported profit — is critical for judging whether a company can fund growth without excessive additional borrowing.
Best Free Tools for Fundamental Analysis
- TradingView: Useful for combining basic fundamental data with charting, in one place.
- Investing.com: Broad coverage of global markets, financial data, and company news.
- Yahoo Finance: Free access to financial statements, ratios, and historical data for most listed companies.
- TIKR: Detailed historical financials and analyst estimates, popular with value investors.
- Screener.in: A widely used free tool for screening and analyzing listed companies with detailed ratio breakdowns, especially popular among South Asian retail investors.
- NEPSE Official Website: The primary source for Nepal-listed company disclosures, price data, and corporate announcements.
- Company Investor-Relations Pages: The most authoritative source for annual reports, presentations, and official disclosures directly from the company.
Frequently Asked Questions
1. What is fundamental analysis?
Fundamental analysis is the process of evaluating a company’s financial statements, business quality, and competitive position to estimate its intrinsic value, rather than relying solely on its current market price.
2. Is fundamental analysis good for beginners?
Yes. It’s arguably the most beginner-friendly approach to long-term investing, since it’s based on understandable business fundamentals rather than fast-moving price charts, and it can be learned gradually one concept at a time.
3. Which ratio is most important?
No single ratio stands above all others — ROE, debt-to-equity, and free cash flow are commonly considered core starting points, but ratios are most useful when analyzed together and compared to industry peers.
4. What is a good PE ratio?
It depends heavily on the industry and growth rate, but many investors view a PE roughly in line with or below the industry average, especially relative to earnings growth, as reasonable.
5. What is a good ROE?
An ROE of 15% or higher is generally considered strong, though the right benchmark varies by industry and should be compared against direct peers.
6. How much debt is too much?
A debt-to-equity ratio above 2, especially paired with weak free cash flow or thin interest coverage, is generally considered a risk signal, though capital-intensive industries naturally carry more debt.
7. What is intrinsic value?
Intrinsic value is an estimate of what a business is genuinely worth based on its ability to generate cash for its owners over time, independent of its current stock price.
8. Can fundamental analysis predict stock prices?
No. It helps estimate whether a stock is undervalued or overvalued relative to the business, but it doesn’t predict short-term price movements, which are influenced by sentiment and other factors.
9. How often should I review a stock?
Reviewing quarterly earnings and any major company announcements is a common practice for long-term investors, with a deeper annual review alongside the yearly report.
10. Is DCF necessary for beginners?
Not strictly — beginners can start with simpler ratio-based analysis and gradually learn DCF as they become more comfortable with financial statements.
11. How do I find multibagger stocks?
There’s no guaranteed formula, but investors often look for companies with consistent earnings growth, strong ROE, low debt, a durable competitive advantage, and reasonable valuation — bought early and held through their growth phase.
12. What is the difference between EPS and PE?
EPS (earnings per share) measures how much profit a company makes per share; PE (price-to-earnings) measures how much investors are paying for each dollar of that profit.
13. What is a margin of safety?
Margin of safety means buying a stock at a meaningful discount to its estimated intrinsic value, creating a cushion in case your valuation assumptions turn out to be too optimistic.
14. Should I buy a stock with negative cash flow?
It depends on context — some high-growth companies deliberately run negative free cash flow while investing heavily for expansion, but persistent negative cash flow without a clear path to profitability is generally a warning sign.
15. What is the best free stock analysis tool?
There’s no single “best” tool — Yahoo Finance and Investing.com are strong for general data, TIKR and Screener.in are strong for deeper ratio analysis, and NEPSE’s website is essential for Nepal-specific disclosures.
16. What’s the difference between ROE and ROCE?
ROE measures returns generated on shareholders’ equity alone, while ROCE measures returns on all capital employed, including debt — making ROCE useful for comparing companies with different capital structures.
17. Why do analysts use free cash flow instead of net profit?
Free cash flow reflects actual cash generated after necessary reinvestment, which is harder to manipulate through accounting choices than reported net profit.
18. What is a moat in investing?
A moat is a durable competitive advantage — like a strong brand, network effect, or cost advantage — that protects a company’s profits from competitors over the long term.
19. Should beginners focus on growth or value stocks?
It depends on risk tolerance and time horizon — younger investors with a longer runway often lean toward growth, while more conservative investors may prefer value or dividend-paying stocks.
20. How is fundamental analysis different for banks versus manufacturers?
Banks are typically evaluated using metrics like capital adequacy and non-performing loans rather than standard inventory or margin ratios, since their business model and balance sheet structure are fundamentally different from manufacturing companies.
Conclusion
Here’s the core of what we’ve covered:
- Fundamental analysis evaluates a business’s real financial health, not just its stock price movement.
- The three financial statements — income statement, balance sheet, and cash flow statement — are the foundation of every analysis.
- Ratios like ROE, debt-to-equity, and free cash flow help you compare companies objectively.
- Reading the annual report, including the notes and auditor’s opinion, reveals what headline numbers alone can’t.
- A durable competitive advantage (moat) and honest management are what separate lasting compounders from short-lived winners.
- Intrinsic value and margin of safety, concepts championed by Benjamin Graham and Warren Buffett, help protect you from overpaying.
- A simple, repeatable framework beats emotional, headline-driven decisions every time.
The next step is practice: start reading annual reports, build a watchlist of companies you understand, and analyze each one using the framework above before you invest a single dollar. Long-term wealth is built by focusing on business quality and patience — not short-term speculation.
Suggested internal links: “Technical Analysis Guide,” “PE Ratio Explained,” “DCF Calculator,” “How to Read a Balance Sheet,” and “Best Stocks for Long-Term Investment.”
Suggested image alt text for this article: “fundamental-analysis-income-statement-example”, “balance-sheet-explained-for-beginners”, “cash-flow-statement-diagram”, “pe-ratio-formula-example”, “roe-vs-roce-comparison”, “intrinsic-value-margin-of-safety-chart”, “dcf-valuation-model-example”, “annual-report-reading-guide”, “economic-moat-types-diagram”, “10-minute-fundamental-analysis-checklist”.
Suggested schema markup: Article schema, FAQPage schema (for the FAQ section above), BreadcrumbList schema, and HowTo schema (for the 10-Minute Fundamental Analysis Framework).
